Smart Meter Anomaly Detection
Challenge #14: "Anomaly Detection for Smart Meter Devices" from the open energy hackdays 2020
Presentation
meterOS - Smart Meter Anomaly Detection
Challenge #14: "Anomaly Detection for Smart Meter Devices" from the open energy hackdays 2020 (Clemap)
Energy consumption in buildings and industry is often wasted due to user behaviour, human error, and poorly performing equipment. In this context, identifying abnormal consumption power behavior can be an important part of reducing peak energy consumption and changing undesirable user behavior. With the widespread rollouts of smart meters, normal operating consumption can be learned over time and used to identify or flag abnormal consumption. Such information can help indicate to users when their equipment is not operating as normal and can help to change user behavior or to even indicate what the problem appliances may be to implement lasting changes.
This challenge is looking for data scientists to apply their skills to an anomaly detection problem using smart meter data. Ideally, such an algorithm should begin to operate after as little as 3 months and should improve over time. A platform to visualise the anomalies would also be useful. Users can select any type of machine learning algorithms that they wish to in order to detect the anomalies from the data.
Group Members
- Raimund Neubauer
- Vikram Bhatnagar
- David Giger
- Marius Giger
In Collaboration with
- Manuel Baez
- Konstantin Golubev
- Xue Wang
The pitch can be found ./20200829_meterOS_Energy_Data_Hackdays_2020_Pitch.pptx.
Data
A sample including smart meter data can be found on kaggle. Participants are encouraged to find other smart meter data to work with in order to test their algorithms.
During the course of the Hackathon, we have created multiple other anonymised datasets (kindly provided by Solarify) that can be found under ./anomaly-detection-model/data.
Approach
- Create a basic model to detect anomalies
- Create a visualization layer to present anomalies
- Get more data of smart meters and possibly publish the datasets on opendata
- Implement a flexible architecture to allow the online processing of new data points
- Simulate incoming data with the newly acquired datasets
- Implement online prediction of anomalies
- Implement online learning

Implementation

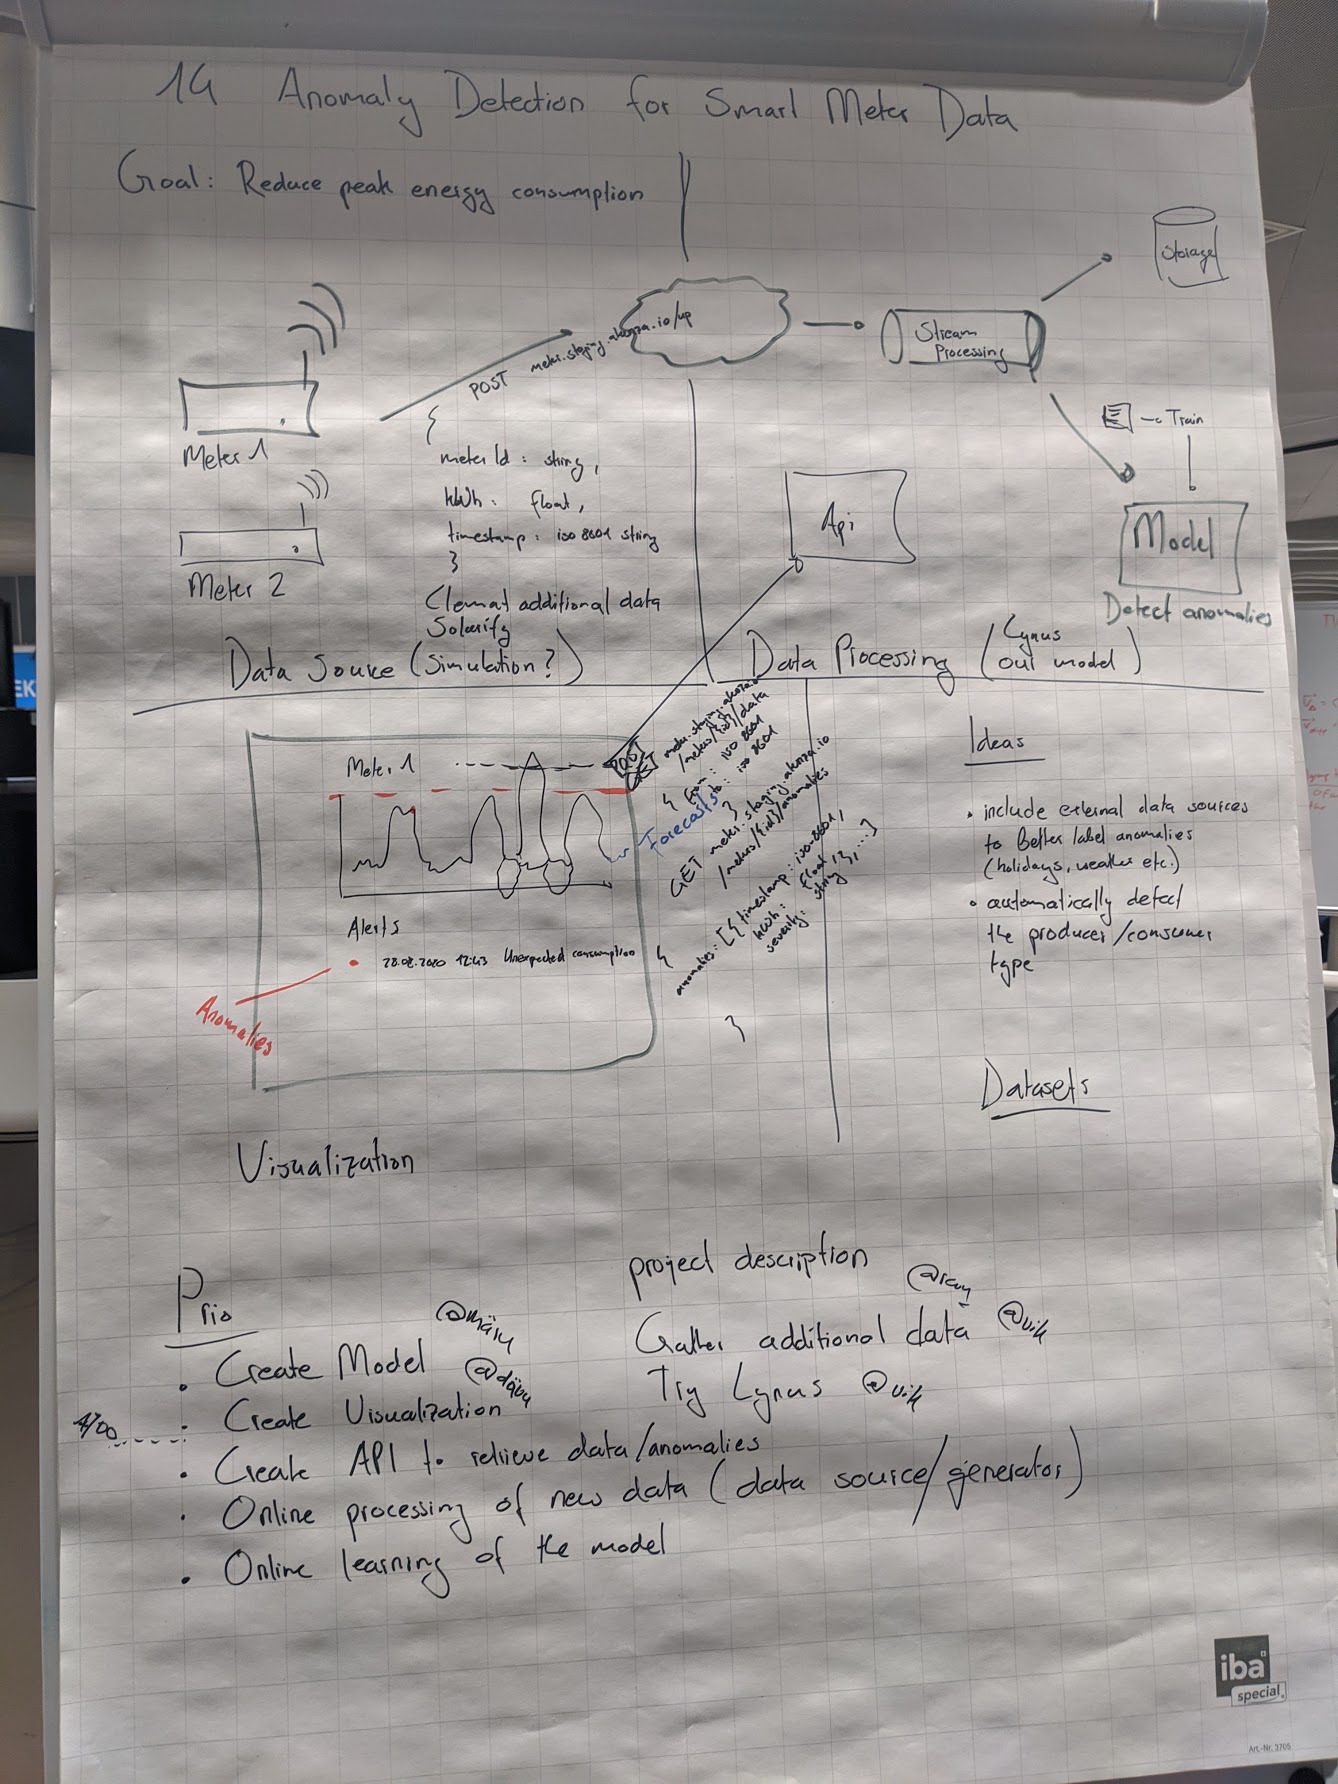
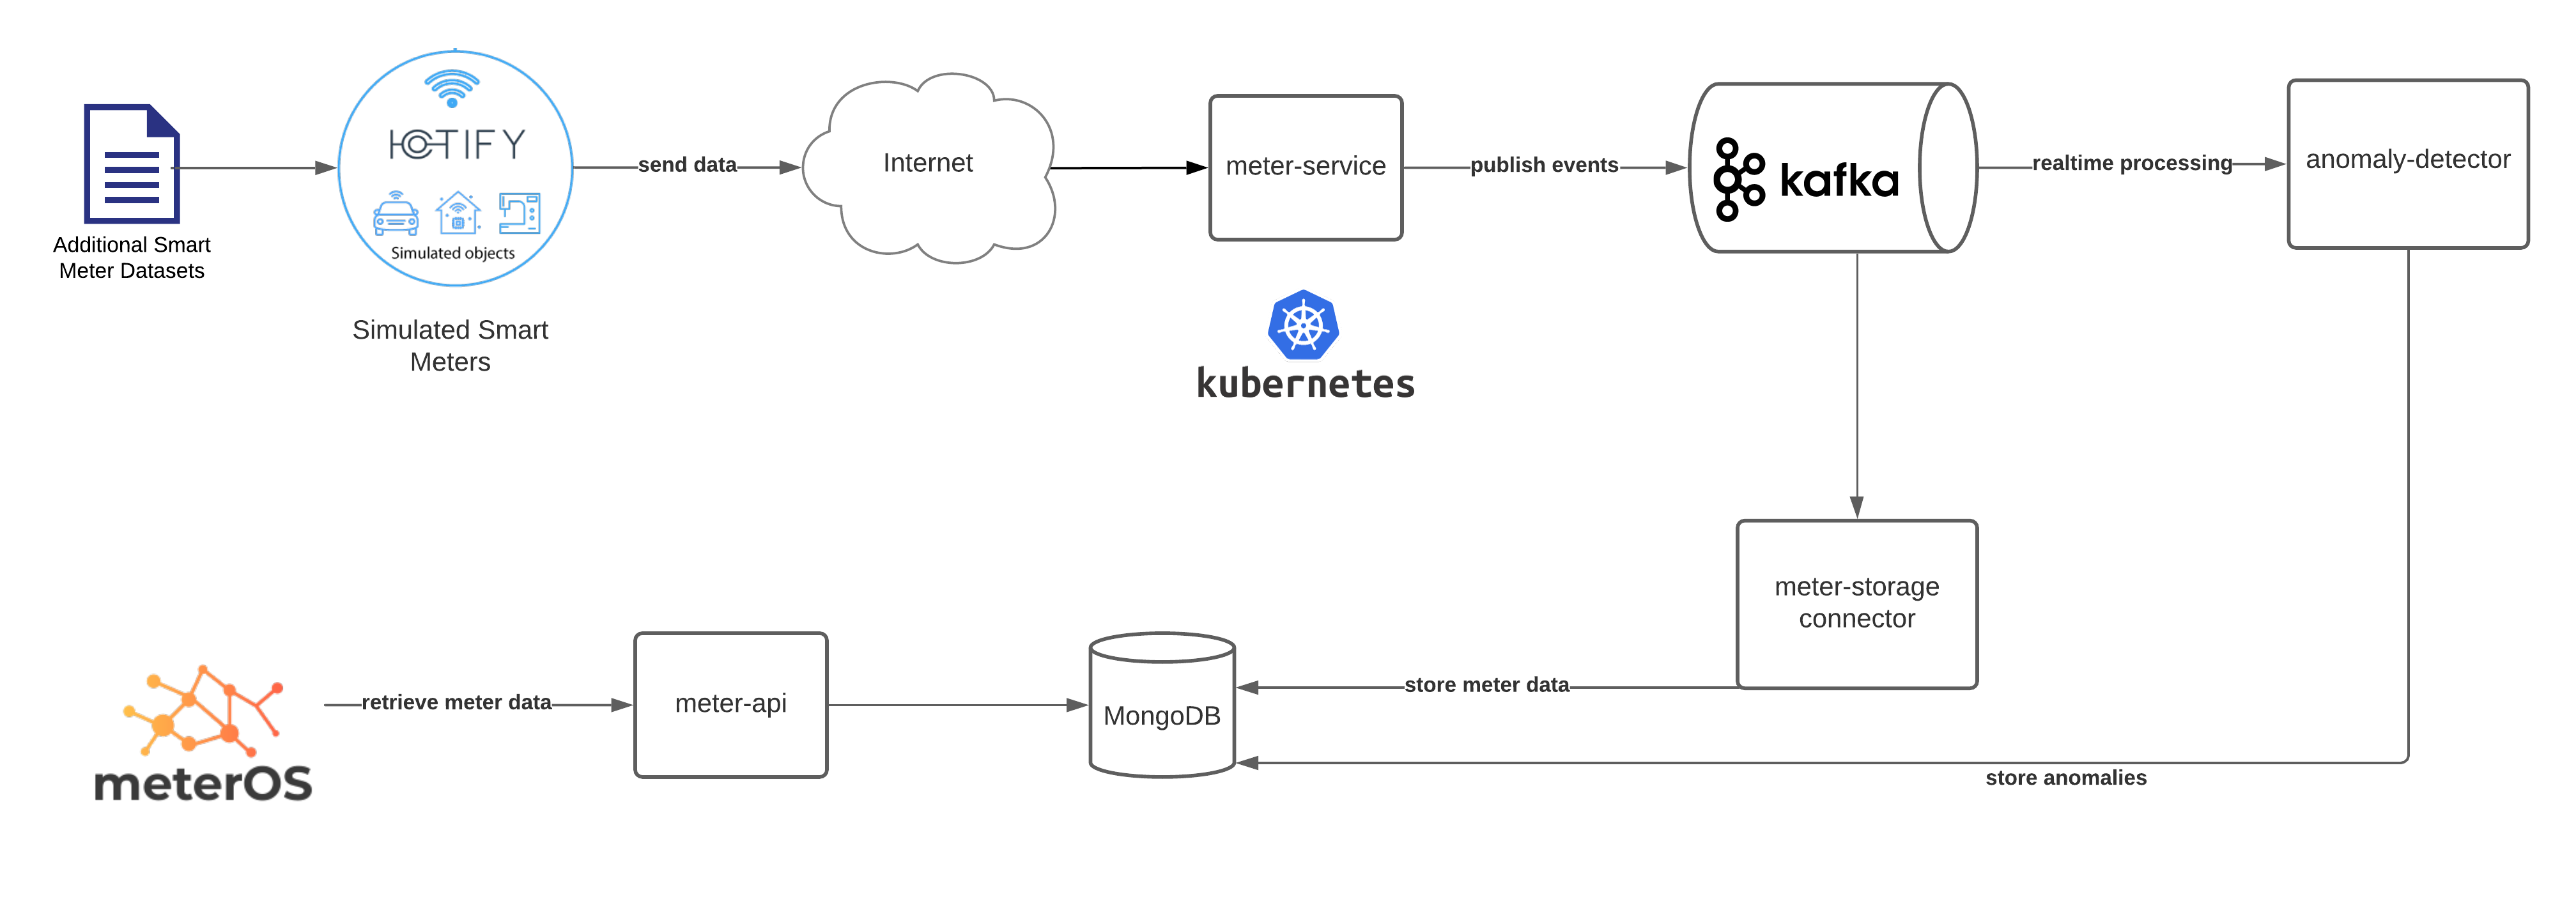
We have implemented a scalable architecture, based on the following components:
- Smart Meter Simulator based on Iotify
- Meter-Service: Microservice that receives, processes, stores and exposes meter data
- Meter-UI (meterOS): UI to display meter data and anomalies
- Anomaly-Detector: Running App with deployed Anomaly Detector model (Thanks to Konstantin Golubev, Manuel Baez, Xue Wang)
- Kafka Data Stream for real time processing
Model Selection
Our approach is to combine expert knowhow and statistical models to detect anomalies. Further, for us to understand if our model has produced useful outputs, anomalies should be labelled based on a predefined set of characteristics (e.g. peak energy consumption, high baseload etc.).
Expert Model
To find out what a human would consider as an anomaly, we did an extensive analysis on a smart meter dataset: ./anomaly-detection-model/Manual_Anomaly_Detection_V3.docx.
Very simple cases of anomalies should actually be detected using expert knowhow. For this, we defined a standardised expert model based on historic data:
- Structure load curve on weekly basis
Possible Features:
- Baseload (especially during weekends)
- total baseload
- delta baseload
- Fast Fourier Transform (Frequency Analysis)
- small variance in amplitude is good for energy producer
- Gradient might be interesting, because it might indicate unusual increases in energy consumption
- Negative values
- Zero values
Stats/ML-based
A more sophisticated ML/Stats-based model should be used to find unusual patterns, that are hard to detect by static rules and therefore might not be easily quantifiable by experts.
Models
We have tried the following models:
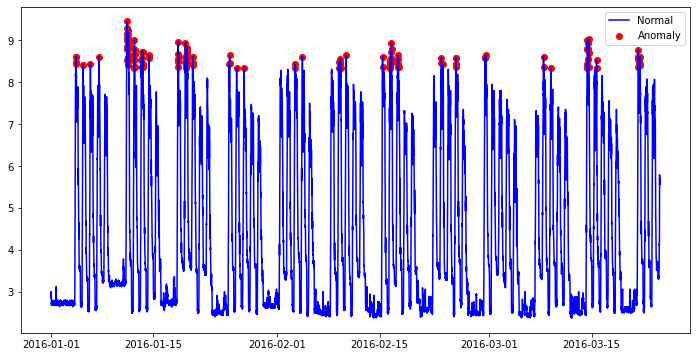
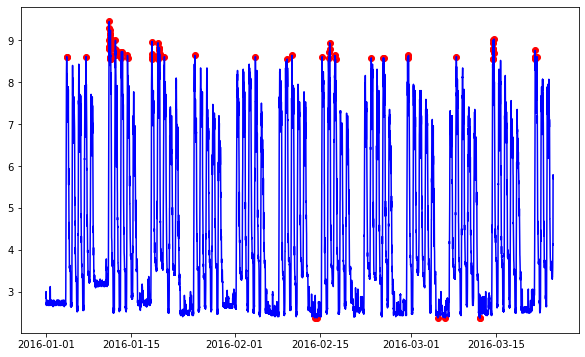
- Isolation Forest: Isolation Forest detects anomalies purely based on the fact that anomalies are data points that are few and different.

- One Class SVM: Unsupervised Outlier Detection based on a Support Vector Machine. It is known to be sensitive to outliers.

- ARIMA Model: Time-series forecasting model and analysis of the prediction deviation. Also possible to spot patterns accross time.


- Monte Carlo Model: Frequency analysis of kWh values. Monte Carlo Approach -- call single reading of a meter anomalous if it hasn't appeared often in the past. Blazingly Fast (can run on Raspberry Pi), Adaptive, Easy to tune. Not able to detect patterns that span accross time.
A possible way forward could be to implement different models for different temporal patterns:
- Minutely/Hourly Model (Online) --> Predictive Model
- Daily Model (Historic)
- Weekly Model (Historic)
Previous
Energy Data Hackdays 2020
Next project

