When do Balance Energy Prices Skyrocket?
The original challenge is here. See also details of a Data Expedition for continual improvements to data availability.
Contact
Bundesamt für Energie, Lucas Tochtermann
When do Balance Energy Prices Skyrocket?
Presented at Energy Data Hackdays 2024. Fachhochschule Nordwestschweiz, September 12 - 13, 2024. The original slides can be found in CHALLENGE.md
Results
Working in an open source data science environment, we used Jupyter Notebooks to dive into the challenge of understanding and modelling national energy balancing with Python. In our presentation you can see the key outputs, or browse our notebooks and other sources shared on GitHub.
The goal is better understanding of the subject matter through clear presentation of the data. Our data sources, as well as further literature and links that were referenced can be found in a section further on.
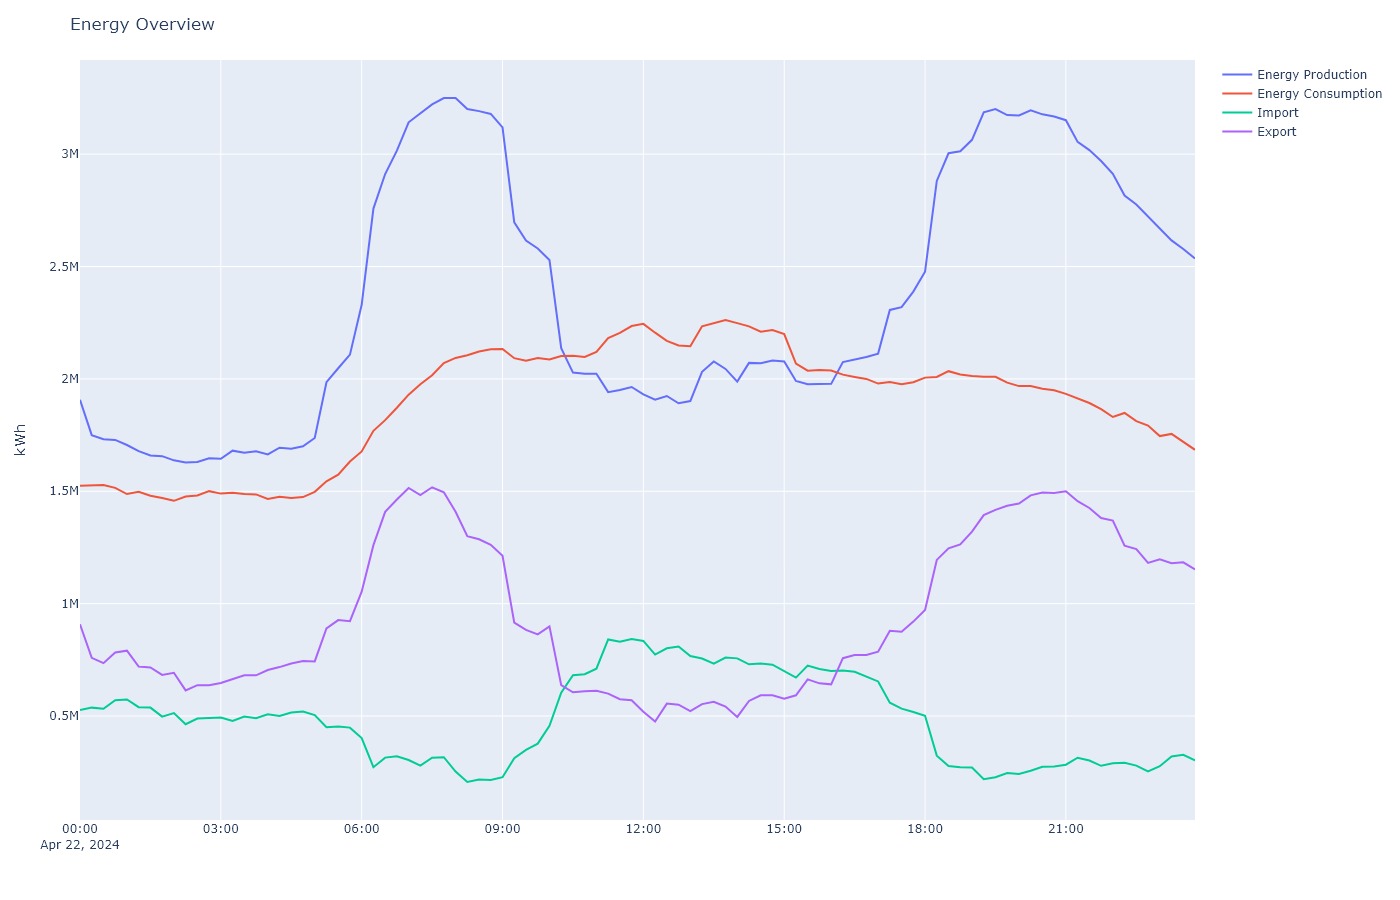
An initial Energy Overview was done by combining outputs from five energy sources with data available for this year:

Comparison of Share and Price of Tertiary Energy

Comparison of Amount and Price of Tertiary Energy

Energy Overview

We started mocking up a basic dashboard using Marimo, which could include further read-outs and interactive graphs.

Prediction of load levels was done with Chronos forecasting running in a Runpod, as shown here:

We also ran tests in the SARIMAX and Nixtla forecasting libraries.
Finally, a Timeline of April 22 events was started by collecting key developments in a spreadsheet.
We thank all the participants of the Hackdays, and hope that we provoke further data exploration in the future!
Data
| Dataset | File | Source |
|---|---|---|
| Day-ahead prices, hourly | auction_spot_prices_switzerland_2024.csv | EPEX |
| Day-ahead traded volumes, hourly | auction_spot_volumes_switzerland_2024.csv | EPEX |
| Balancing prices for BGs short/long, 15min | balancing_prices_2024.csv | Swissgrid |
| Day-ahead prices, hourly | day_ahead_prices_CH_2024.csv | ENTSO-E |
| Swiss power generation per type, hourly | generation_per_type.csv | ENTSO-E |
| Swiss power generation per type (staging), hourly | generation_per_type_staging.csv | ENTSO-E |
| Yearly calendar of events | kalender_2024_ch.csv | - |
| Legend of Meteoschweiz columns | legende meteoschweiz.csv | Meteoschweiz |
| Consumption schedule, hourly | load.csv | ENTSO-E |
| Consumption Schedule (staging), hourly | load_staging.csv | ENTSO-E |
| Weather data | staging_ms_6120.csv | Meteoschweiz |
| Weather data (unprocessed) | staging_ms_6121.csv | Meteoschweiz |
| Problems reported in power supply | unavailability_of_generation_units.csv | ENTSO-E |
Join our Data Expedition to help efforts to catalog and support open data for projects like this one. Further links can be found in the Resources section of the Hackdays.
Notes
Since it is not possible for the market participants to have all the information we have, we have to reconstruct the probable situation from the available sources - and if we recognize patterns, find out in which combination the variables become important. To learn about pricing models for power trading, see this With The Grid blog post.
Swissgrid has to pay the current balancing price, and there is little to counter speculation and mispredictions. Few understand the background about the schedules and how Swissgrid organizes the grid operation. The Swissgrid website has various documents that illustrate the matter.
For a brief intro to statistical forecasting with Python, see SARIMAX at Statsmodels.org
In the Media
These articles on the events in April were mentioned in the Challenge presentation:
Projects
We found these prior Hackday and other projects inspirational:
- Visistrom (2019)
- Electricity Maps (2020)
- Trends in tertiary energy prices (2021)
- Experimental Statistics ML_SoSi BFS (2023)
- Füllungsgrad der Speicherseen BFE (2024)
- DataHub - Brent and WTI Spot Prices
- UK Energy Dashboard (Source, Data)
- Visualization of the European transmission network with Plotly and the PyPSA-Eur package
Simulation as Game
Inspired by Koboldgames, who supported previous Energy Hackdays and have developed serious games involving environmental and economics models, we researched whether games are being used to simulate and teach power systems.
- Barrios-O’Neill, Hook (2016)
- Fate of the World (2011)
- Green with Energy (2024)
- How video games prepared me for energy modelling (LinkedIn)
We used Etherpad (hosted at OKFN DE) to collaborate on these notes.
Previous
Energy Data Hackdays 2024


